


Static code analysis is a process of inspecting the source code to get some insights without actually running it. Which is why we call that process static. Static analysis outputs range between metrics, vulnerabilities reports, potential bugs alerts, code style hints, etc. You can use it during development or as a part of code review automation.
In the first part of this blog post, I would like to show how you can leverage static code analysis to find issues in your code and refactor it. The problem is that if we just keep refactoring, we’re not always providing business value (more on that later).
For better or worse, I’m not going to talk about ESLint. ESLint is an excellent and rightfully popular tool, but I would like to focus on a few complementary tools which are not that mainstream in the JavaScript community. In the second part of this blog post, I would like to put more emphasis on metrics.
For this blog post, I needed a sample project. Ideally, in TypeScript and React, open-sourced, something with more than just a few GitHub starts. I’ve settled on clintonwoo/hackernews-react-graphql, with 3.8k+ stars at the time of writing. I wanted a popular project because if we catch an issue, it will be that much better of a case for using static code analysis. I assume that the more people are reading the code, the more likely it is that someone will make a PR with a fix. I've cloned it and created this example repo.
dependency-cruiser
With the always growing project, you have to keep track of the complexity. Dependency cruiser is going to give you insights into dependencies between your modules in your codebase. By dependencies, I don’t mean what you have in node_modules but how your code is structured. It works with JavaScript, TypeScript, and even CoffeeScript. Let’s go through the setup:
npm install -D dependency-cruiser- Setup depcruise with
npx depcruise -initand select self-contained configuration
You can now explore the rules in the newly created .dependency-cruiser.js config file. I’ve also modified my example repo to feature a circular dependency to showcase the dependency-cruiser ability to detect it. ESLint too can recognize circular dependencies via its import/no-cycle rule, so it’s not that impressive. There’s a good chance that you have it in your project already anyway!
Where dependency-cruiser shines is helping you to remove code. When I refactor or develop new features, I’m particularly happy to remove the old code. It’s less maintenance, smaller bundle size, and you don’t have to care about potential bugs in removed code. When I remove one module, I might forget to remove some imports that other modules don’t use. Dependency cruiser has a standard rule to detect orphaned modules. On top of that, let’s add a custom rule to identify modules that are not reachable from the root of our app. Unreachable or, in other words, none of the starting point files in the import chain is using these modules:
{
  "name": "no-unreachable-from-root",
  "severity": "error",
  "comment":
    "This dependency is unreachable from the root of your project. You might want to remove it",
  "from": {
    "path": "^(pages/[a-z]+\\.tsx|server/server.ts)"
  },
  "to": {
    "path": "src",
    "pathNot": "node_modules|\\.(spec)\\.(js|jsx|ts|tsx)",
    "reachable": false
  }
}
Our Hacker News clone is a Next.js project, so we would like to check if we can reach each module from either any page or our app server. Usually, you could go away with a path from your index file. We’re not going to take tests or node_modules into consideration. Setting severity, we determine that this rule should report as an error.
Before we run the dependency cruiser, let’s simulate a change in the header.tsx. Assume that we don’t need header-nav.tsx anymore and delete both usages of this component and the import statement. Try running dependency cruiser:
npx depcruise --validate .dependency-cruiser.js src pages serverThe output is the following. Apart from my changes, it looks like the Hacker News clone doesn't need global.ts at all.
info no-orphans: src/@types/global.ts
  warn no-circular: src/data/validation/user.ts →
      src/data/validation/isValidUser.ts →
      src/data/validation/user.ts
  warn no-circular: src/data/validation/isValidUser.ts →
      src/data/validation/user.ts →
      src/data/validation/isValidUser.ts
  error no-unreachable-from-root: src/components/header-nav.tsx
  error no-unreachable-from-root: src/@types/global.ts

✖ 5 dependency violations (2 errors, 2 warnings). 161 modules, 482 dependencies cruised.
Validation rules are what I find especially helpful in my work, but dependency cruiser can also generate graphs of dependencies. I don’t see it as useful in big codebases, to visualize the entire project the generated image is going to be so large and complex you’re going to have a hard time trying to make sense out of it. The graph of a microservice and independent module can be an excellent resource for onboarding new people. You can generate the graph from modules in src, server, and pages directory skipping all spec files with the following command.
npx depcruise --include-only "^(src|server|pages)" \
  -x "\\.spec\\." --output-type dot . | dot -T svg > dependencygraph.svg
To generate a graph, you also need a dot, a Graphviz command line program.
ts-unused-exports
The shortcoming of the dependency cruiser is that it deals with entire modules. After changes or refactoring, you may find yourself with unused exports, and since other exports from the same module are in use, the dependency cruiser won’t complain. That’s why it’s good to supplement your static code analysis toolbox with a tool that can detect unused exports. For our TypeScript project, I use ts-unused-exports, but for plain JavaScript, you can use a similar no-unused-export package. Install ts-unused-exports and run it:
npm install -D ts-unused-exports

npx ts-unused-exports tsconfig.json pages/*.tsx src/**/*.ts server/**/*.ts \
  --showLineNumber --excludePathsFromReport=/pages/
We have to tell ts-unused-exports the path to the tscondig.json file and again specify all file patterns we want to analyze. In Next.js, pages have default export that is a page component consumed by the Next.js router. We don’t import pages explicitly in our code, and we want to exclude “unused” pages from the report. Running ts-unused-exports, on the example repository, gives us the following result:
4 modules with unused exports
/src/config.ts[2,0]: IS_SERVER
/src/config.ts[6,0]: graphiQLPath
/src/config.ts[9,0]: appPath
/src/config.ts[15,0]: HOST_NAME
/src/config.ts[17,0]: HOST
/src/config.ts[21,0]: GRAPHIQL_URL
/src/data/mutations/hide-news-item-mutation.ts[3,0]: HIDE_NEWS_ITEM_MUTATION
/src/data/mutations/submit-news-item-mutation.ts[5,0]: ISubmitNewsItemGraphQL
/src/data/mutations/upvote-news-item-mutation.ts[3,0]: UPVOTE_NEWS_ITEM_MUTATION
As you can see, we’ve found quite a few unused exports throughout the project. To completely clean up the codebase, it takes a few refactor cycles and reruns seeking remaining unused modules and exports. After removing the one batch of unused exports/modules, you may end up with more unused dependencies that were consumed only by code that has now been removed.
SonarQube (bugs, security, code smells)
SonarQube is a much more robust toolset. SonarQube works with multiple programming languages, JavaScript/TypeScript included. There’s a good chance your entire team could use it across your technology stack. SonarQube focuses on code quality and security, can track different code metrics overtime, and augment the code review process. Usually, you deploy SonarQube as a separate self-hosted web service with a database connection. Then you integrate it with your CI/CD and source code management (e.g., GitHub). For evaluation purposes, we’re just going to use the free community edition and run it locally using a Docker container.
Spin up the container with SonarQube instance running on port 9000.
docker run -it --rm --name sonarqube -p 9000:9000 sonarqube:8.5.1-communityGo to the dashboard on localhost:9000 and login with admin/admin. Click “Create new project” and then type something in the project key and display name (the name doesn't matter too much). Give a name for your token (also doesn’t matter too much). You don’t need to copy the token. Just click “Continue”, select language, and the system on which you run. You need sonar-scanner available in your PATH. You can download it from here. Next, copy the sonar-scanner command which is going to look like this:
sonar-scanner \
  -Dsonar.projectKey=test \
  -Dsonar.sources=. \
  -Dsonar.host.url=http://localhost:9000 \
  -Dsonar.login=b545eb845231ad25bb673e3e4c596d450d7c1c04
Run it in the root of your project. It’s smart enough to figure out the rest. After about 30 seconds, you can find a new report on the dashboard. Simple as that. Before we dig into it, go to the Project Settings -> Quality Profiles -> Change JavaScript/TypeScript to “Sonar way recommended.” It’s going to let us scrutinize the project even more. Rerun the scanner using the same command as shown above this paragraph.
Generated reports contain potential 11 bugs. Let’s go through them. It found 9 issues in CSS files. Mostly unknown properties and missing generic fonts.
In new-feed.tsx on line 60, it found the same expression on both sides of the && operator. Good catch.
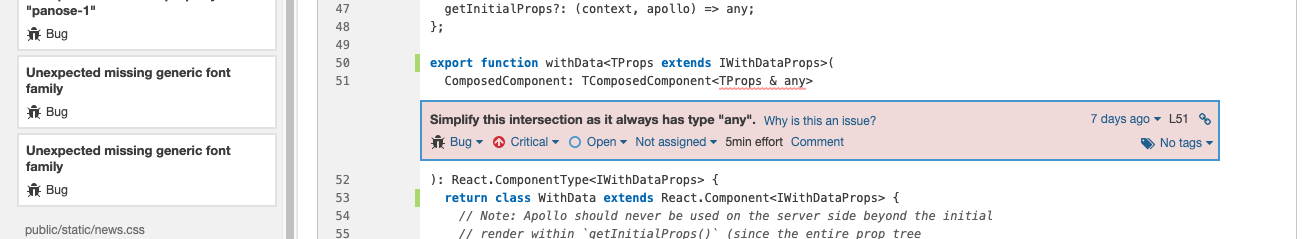
Another is a TypeScript-specific problem, over permissive intersection type combines with any in with-data.tsx on line 51.
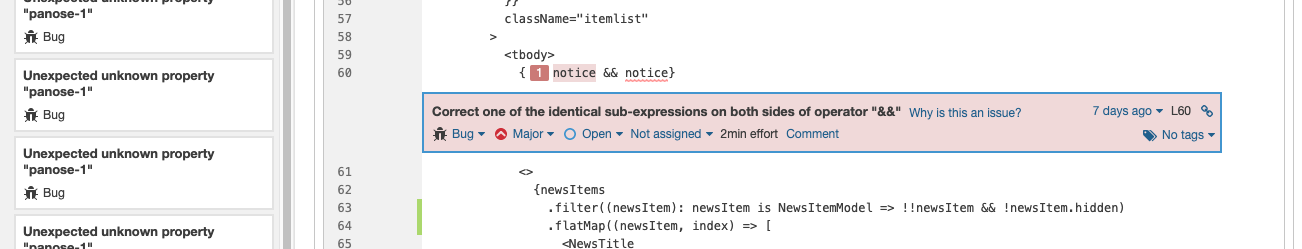
Those last 2 bugs are what I would imagine can be caught by a careful engineer during the code review. The difference is instead of wasting time on being a hero linter/types-man, you can focus on reviewing business logic instead.
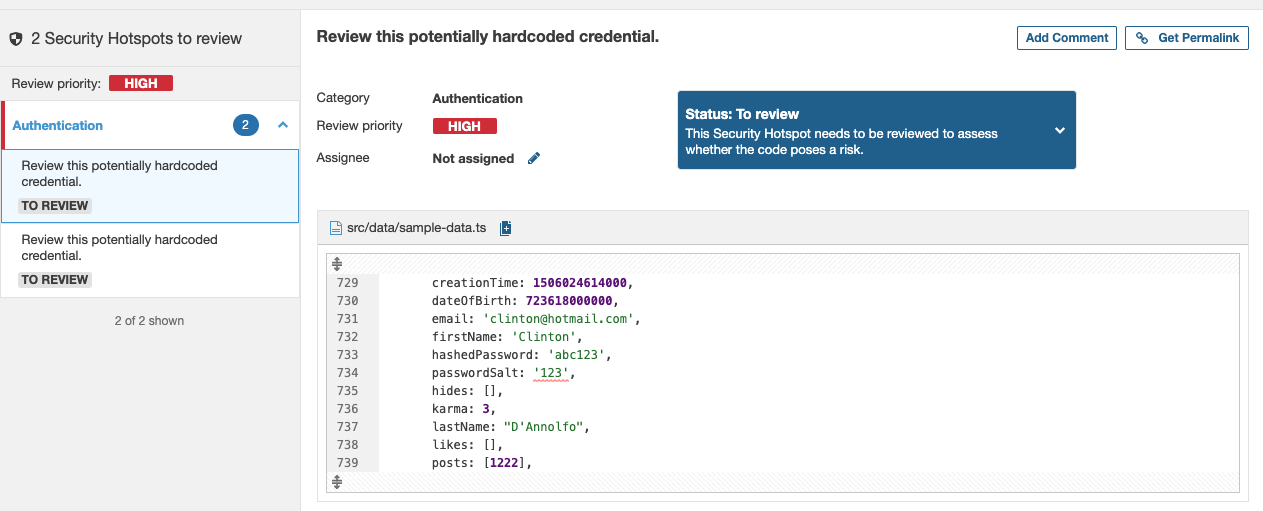
Another part of the report is the security hotspots. Those are usually strings that look like hardcoded passwords and tokens, parts of code that look like you’re rolling out your cryptography instead of using well-tested crypto libraries. In our example repository, we have 2 false positives. We have hardcoded password salt in sample-data.ts. You can mark them as “safe” in the Security Hotspots tab. It shows that sometimes it’s nice to have an interactive graphical environment instead of a command-line tool.
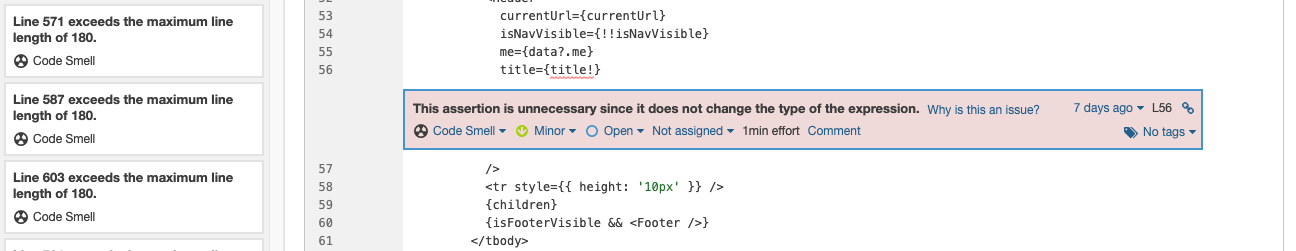
Next are code smells. There’re a few issues here. In our example repository, most of them are assigned unused variables and duplicated CSS selectors. The last one is another good catch. In main-layout.tsx on line 56, there’s an unnecessary non-null assertion.
If you’ve enabled "Sonar way recommended" quality profile, you’ll see many more reported code smells. I encourage you to explore them on your own. In the next part, I would like to focus more on metrics.
SonarQube (technical debt, coverage, duplication)
You might want to rely on your gut feeling when it comes to code quality, but this is not very sustainable for bigger teams. Engineers with different backgrounds (e.g., OOP vs. FP) have a different sense of what quality means, where the complexity lies, and what is a better design pattern for the given problem. This is all normal and often a foundation of meaningful software design discussions, but it doesn’t convey well to business people.
It’s not uncommon that business requirements pressure developer teams to release features and not iterate on what’s already working from the user perspective. It’s not an excellent strategy for maintaining a healthy codebase. It’s good to have metrics on your side to win over this much needed time for maintenance and refactoring. The point is, businesses understand metrics and not why “we need to rewrite this” mambo jambo.
Although not very precise, a great metric is technical debt. You can open a SonarQube report and see technical debt expressed in the form of time it takes to refactor the code to the point of it being debt-free. Our example repository has low technical debt of 1 day, but a substantial project is going to have a much higher value. You also need to maintain a healthy perspective that the technical debt is not all evil. Like any dept, this is something you can leverage. You increase it to release a feature quickly and slowly pay it off later. The question is, why should we pay off the technical debt, and what is a suitable amount?
If you have 7 days of technical debt in your core service or a key feature, there’s a danger that this is how long it’s going to take to fix a bug there. Is your business willing to take the risk of having a degraded user experience for a week for a given feature? If yes, you move on, if not, you just won your team a hefty time for refactoring.
Another metric is code coverage. First of all, you have to instruct SonarQube where to look for LCOV files. Create a sonar-project.properties file with the following content:
// sonar-project.properties
sonar.javascript.lcov.reportPaths=coverage/lcov.info
Run your tests:
npm run test -- --coverageThe next SonarQube report should now show a test coverage of around 40%. You can then explore coverage for each file and see where you might need to double down on making sure the code works as expected. Either by manual testing or just improving the coverage.
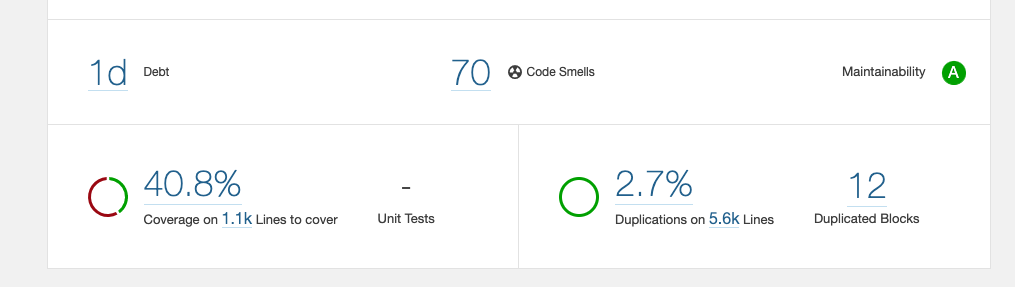
Yet another constituent of the SonarQube report is code duplication. Use it to find a potential piece of code you could make into a reusable component or a function. Similar to code coverage, I wouldn’t chase numbers here for the sake of improving statistics. Be pragmatic about it and remember that duplication is far cheaper than the wrong abstraction.
Another metric that can help you to increase the simplicity of your code (and the quality) is cyclomatic complexity and cognitive complexity. The first one measures the number of possible paths in the code execution flow. Cognitive complexity increases with breaks in linear code execution and nested structures. Eg. It’s easy to understand a switch statement (low cognitive complexity), but the more cases, the higher the cyclomatic complexity.
On the other hand, a loop has low cyclomatic complexity. It is “cognitively” harder to understand the loop than a set of instructions one after another. The difference between the two is not that important, just know that it’s difficult to reason about the code with a high cyclomatic complexity and cognitive complexity. In SonarQube, you can explore the complexity of each file in the measures tab.
Summary
In the maturing JavaScript/TypeScript community, we can enjoy more and more tooling to help us develop better software. I think it would be a shame not to take advantage of the static code analysis tools. They are not yet perfect, and sometimes we have to jump through more hoops than we would like to, but the power of automated workflows is, in my opinion, worth it.
I hope you found this blog post useful, and you’re going to give a few new tools a try. What’s your experience of using static code analysis? Are you particularly happy with any tool? Feel free to share it in the comments!
This article has been originally posted on LogRocket's blog: How to use static code analysis to write quality JavaScript/TypeScript
Photo by Evgeni Tcherkasski on Unsplash.